Home About Links Hobbycraft Photos Downloads
Florida Economy
|
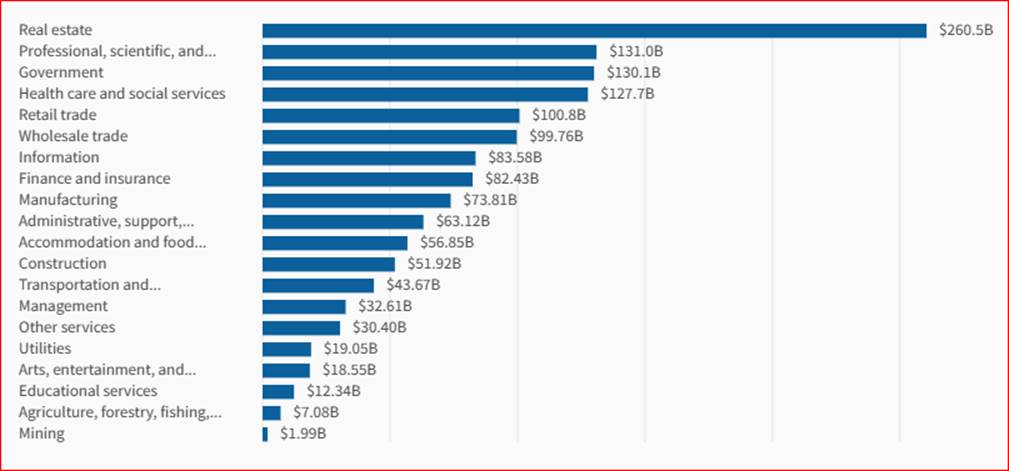
Gross domestic product (GDP) is the primary measure of an area’s economy. GDP is the summation of all the money spent by consumers, businesses, and government in a given period. In the 1st quarter of 2023, the real GDP for Florida was $1.4 trillion in goods and services per year. Real gross domestic product in Florida, by industry (Q1-2023)
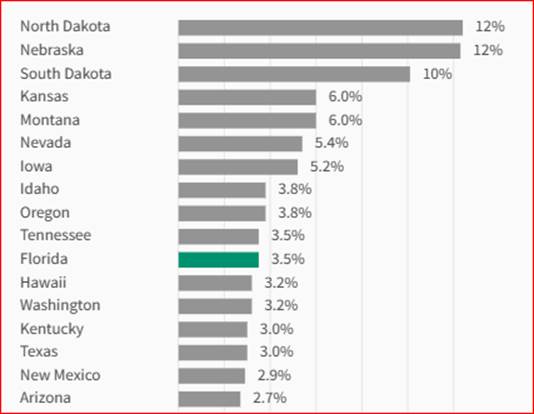
Real GDP growth in 1st quarter of 2023, by state; Florida was tied for 10th
Florida cost of living: Ranks 32nd lowest cost of living in the United States. The average total personal consumption cost in Florida is $50,689 per year Nations large metros with biggest increase in living cost 4. Miami-Fort Lauderdale-Pompano Beach, FL · Percentage change in cost of living (2010–2020): +21.3% · Overall cost of living (compared to average): +10.0% · Cost of goods (compared to average): +2.9% · Cost of housing (compared to average): +44.1% · Cost of utilities (compared to average): -5.5% 3. Portland-Vancouver-Hillsboro, OR-WA · Percentage change in cost of living (2010–2020): +22.0% · Overall cost of living (compared to average): +5.7% · Cost of goods (compared to average): +3.8% · Cost of housing (compared to average): +30.5% · Cost of utilities (compared to average): -9.3% 2. Denver-Aurora-Lakewood, CO · Percentage change in cost of living (2010–2020): +22.9% · Overall cost of living (compared to average): +7.3% · Cost of goods (compared to average): +5.5% · Cost of housing (compared to average): +45.7% · Cost of utilities (compared to average): -14.4% 1. Seattle-Tacoma-Bellevue, WA · Percentage change in cost of living (2010–2020): +23.2% · Overall cost of living (compared to average): +12.0% · Cost of goods (compared to average): +11.4% · Cost of housing (compared to average): +52.3% · Cost of utilities (compared to average): -8.9% |